nedjelja, prosinca 28, 2014

Does Santa use GPS?

'Tis the season to be jolly... and wonder how Santa Claus gets around the world in just one night, getting every child's address right, especially considering that the world population gets bigger and bigger every year. The world today counts around 7,2 billion and around 31% are Christians, so that's a pretty large number of kids to visit in just one night!

Does he use a GPS to get around? Maybe... It would definitely make sense, considering the daunting responsibility that rests on his shoulders, so that option makes sense to me, technically speaking. But thinking that he's been around for so long, and that there's definitely magic involved with everything Santa does, at heart I believe he prefers the old-fashioned stellar navigation.

source: prweb.com
Whichever the case, there's a few websites that let you keep track of Santa's progress through the Christmas night, so you can stay up and wait for him with cookies and milk and ask for yourself about how he navigates the skies; here's to list just a few:

Google's Santa tracker  - personally my favorite :) 
NORAD's website
TrackSanta

source: santatracker.google.com

Santa did his job really well this yeas, as always, so he's taking his well-deserved break till the preparations begin for next season. And the mystery still remains as to how he gets around the whole globe in just one night...

nedjelja, studenoga 16, 2014

Online Courses

I've been doing a lot of ESRI online courses lately as part of the UNIGIS program, and I have to say - they're really good. There are two basic types of courses offered by ESRI - instructor-led courses and online courses. Being in Ecuador, only the online courses are available to me, though I hope to someday be able to have a live course too.


The online courses are nothing to complain about, though. Lots of useful topics with a good theoretical introduction, often solidifying the basics and then followed by well-explained exercises - a good combination between theory and practice. So far, my favorites are the 3D visualization technique courses and site selection courses.

Sometimes, though, it can be difficult to know the best order to take them in, and then I end up doing a more advanced course first or repeating some topics, but that's not such a big problem. After all, repetitio mater studiorum est!

utorak, listopada 07, 2014

Thesis time!

The time has come to face the final challenge in the UNIGIS Master program: the thesis.

Being an ecologist, I wanted the work to take into account my interests, both personal and professional. And, I am currently working on a project regarding the world-famous 
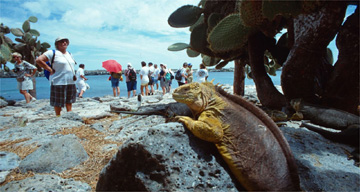
Galapagos Islands in Ecuador, so I thought why not combine both. After some research, I think I found my topic: Identifying terrestrial conservation priorities in the Galapagos Islands, based primarily on anthropogenic threat assessment.

http://nothingtoloseandaworldtosee.files.wordpress.com

The conservation of the famed Galapagos Islands experienced two crucial points during its history: it started officially in 1959 with the creation of the Galapagos National park, and was later expanded to the marine ecosystem by forming the Galapagos Marine Reserve in 1996. However, by that time, the archipelago had experienced severe human influence that first started with the discovery of the Islands in 1535, intensifying strongly with the beginning of organized colonization in 1983 and continuing relentlessly ever since. Today, the Galapagos NP encompasses 96,7% of the islands (7 731 km2) and the Marine Reserve reaches up to 40 miles from the Islands (138 000 km2), but anthropogenic influence is still great and poses a significant threat to the conservation efforts.

The primary factor of influence is tourism, which has sky-rocketed in the last decades, causing strong immigration of the Ecuadorean population from the continent, bringing with it almost complete dependence of energy, food and water from the continent, and causing a host of problems: introduced and invasive species, illegal and uncontrolled fishing, contamination of aquifers and soil, inadequate or (for the most part) inexistent solid waste and residual water management, rampant urbanization, among others. These factors keep altering the fragile ecosystems of the Galapagos Islands, despite the constitutional protection that Pacha Mama (Mother Nature) enjoys in Ecuador and the continuous efforts of the NP and Marine Reserve management.

http://static.guim.co.uk/sys-images/Travel/Pix/pictures/2006/04/19/galapagos360.jpg


Despite the strong scientific interest in Galapagos, there have been few attempts to quantify the anthropogenic influences suffered by the ecosystems. However, it is precisely by means of a thorough evaluation of human risk factors risk that conservation of the Islands should be managed, in order to aim its valuable and costly efforts into particular human activities, specific areas and species.

The objective of the project will be to perform an ecological risk assessment for terrestrial conservation in the Galapagos Islands based on anthropogenic risk factors, and identify areas that represent conservation priorities.

So… the next step is to gather all the information available in order to identify, quantify and spatially delimit the influences that the terrestrial ecosystems of Galapagos face due to various human activities, and also to identify and localize the distribution of target terrestrial species on the islands. With that, it will be possible to identify areas that require particular conservation efforts, based on an overlay of quantified threats and identified species, and finally to produce a map of conservation priority areas.

So now cross my fingers and start working…

nedjelja, kolovoza 03, 2014

Map apps galore

My last blog entry made me want to take a loser look on map apps for smartphones. I have a Sony Xperia so Android app store on Google Play is the basic investigation tool for this task.


Just a small selection of free map apps for Android devices available at Google Play store

So far I have been using Maps and My Tracks, both developed by Google, and I consider them sort of basic types of map apps for any novice user. And what I consider essential is that you can use both offline, so even if you don’t have internet access at all times, you can still use these apps to figure out where you are.


Maps is just like Google Maps that we all access online to search for a specific street, address or business. Their maps are very accurate and the layers available are satellite, terrain, traffic, etc. You can use as Maps a simple and effective navigation tool, search for near-by business and depending on your location in the world, there are live traffic updates and Street View options available.


Maps


My Tracks app is excellent for recording your path, speed, distance, and elevation during any outdoor activity – I’ve tried it during bus rides, cycling and walking and it works perfectly. You can add notes at certain points, view statistics and hear periodic voice announcements of your progress. Your track can be synced on Google Drive and shared with other Google users.

My Tracks


There’s another nice little free app that a lot of outdoorsy people like to use, the MapMyRide. It offers the standard services of mapping your route and tracking the activity type, but it can also keep track of the foods you eat so as to accurately calculate your calorie output.


MapMyRide calorie counter

Then you can go ahead and share your route with your friends and look for interesting routes posted by others in your area or anywhere else you’re planning to visit. A highly recommended app.

A route shared through MapMyRide

There seems to be countless map apps out there, just go ahead and invest a couple of days to try out a few and see which one suits your needs the best. And have fun!

četvrtak, lipnja 26, 2014

Mobile GIS

Mobile technologies keep growing in capabilities, diversity and availability by the week.  The decreasing prices of mobile devices and mobile services, better coverage and new software have made it one of the most dynamic services today - so no wonder that mobile GIS applications are getting more and more popular, both in the professional world and with the average outdoor enthusiast.

Being free from desktop hardware has many advantages. The user can easily use relatively cheap smartphones or tablets to access maps, collect and report data and even perform analysis. The software client interface is usually simpler, the costs of data collection can be greatly reduced and the data can be quickly synchronized with the client’s servers.


However, mobile technology has some drawbacks as well. The small screen size of smartphones, short battery life, limited keyboard functionality and limited processing power are some of the most common shortcomings of mobile GIS.

Nevertheless, most professional GIS software companies, such as ESRI and Google, are investing in this quickly developing market, constantly developing their mobile and online services. But there are also many start-ups and web communities that are developing their own mobile GIS solutions, that may be more easily adapted to personal users or small business needs. There are services that are available online and offline so not even a remote location is out of reach.


utorak, lipnja 10, 2014

ArcGIS Online, a map service for everyone

While working on the latest module of the UNIGIS master course, I am beginning to get acquainted with various online map services. One of the more interesting ones is the ArcGIS Explorer Online, available at http://www.arcgis.com/explorer.

The website offers many interesting user-made theme maps, such as World AIDS Day Map, Import and Export of Plastic Waste, Forest Areas in Europe, etc. These maps can serve as a good starting point or illustration for a student investigation or visual information for the interested public.

ArcGIS Explorer Online

But the real benefit of this map service is the ability to create (and publish) one’s own theme map. The ArcGIS Explorer offers base maps where a user can easily add information of interest, explore overlays and see associated data. You can look for information shared by other users based on keywords, import your own data or use your previously stored information. 


 Add Content in ArcGIS Explorer Online

In this way, the user can explore publicly available or personal data without the need for a professional and expensive software, and what is more, share this information with people he/she chooses or publish it for everyone to access.

For example, I investigated the occurrence of wildfires in the United States and produced a map that can be accessed here. It is fun and easy, really a tool for everyone.


An example of a completed map using public information of wildfire in the USA

And all you need is internet access and some imagination…

utorak, ožujka 04, 2014

More Deforestation Tools

Continuing on the last post, there is great news for those interested in deforestation. The World Resources Institute (WRI, USA) has launched a Global Forest Watch project (GFW) which claims to track forest loss "in near real time".

Making use of Landsat images, Google Earth Engine, Google Earth Maps and algorithms from the University of Maryland, the GFW will be a powerful tool for those needing up-to-date information. Organizations such as NGO's, local grassroot organizations but also politicians and  companies will be able to monitor the areas of particular interest for current information, monitoring the success of environmental policies or the far-trade status of their products.

An example of the areas of tree loss in Ecuador, from GFW project

"From now on, the bad guys cannot hide and the good guys will be recognized for their stewardship." said Dr Andrew Steer from WRI.
For more information, visit http://www.globalforestwatch.org/

Source: BBC News


srijeda, siječnja 01, 2014

Deforestation as seen by Google

Google Earth has been recently used to produce a detailed map of the world’s forest resources and how they have changed between 2000 and 2012. As reported by BBC, a research group at the University of Maryland used the free service to map the forest extent in 2000 and 2014 and then calculated deforestation and reforestation for the period. This interesting project shows how freely available data can be used for high-impact projects. 

Global Forest Change Project used  654,178 Landsat 7 images to document the loss of 2.3 million km2 and gain of 0.8 million km2 from 2000 to 2012. Brazil had marked a large success by reducing deforestation in this period, but this was offset by extreme deforestation in Indonesia, Malaysia, Paraguay and Angola. The largest forest loss was produced in the tropics (2101 km2/year), second by boreal forest loss. 


However, the positive news from Brazil may be too soon to start celebrating, reports the BBC. Brazilian minister Izabella Teixeira has recently commented that deforestation rate has increased by a staggering 28% between August 2012 and July 2013, despite the reduction in previous years.

Whatever the case may be, the Global Forest Change Project may prove to be a strong investigation tool, since it can be updated annually and at a fraction of a cost of commercial imaging services. This global imaging service may prove to be a strong information source to governments and activist groups in fighting illegal deforestation, control and planning, should they choose to use it.

For more information, visit the project map by the University of Maryland or read the original research article here.

I may not have gone where I wanted to go, but I'm sure I ended up where I needed to be.