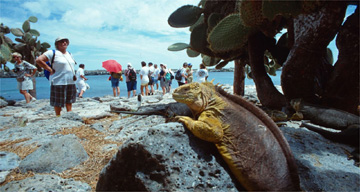
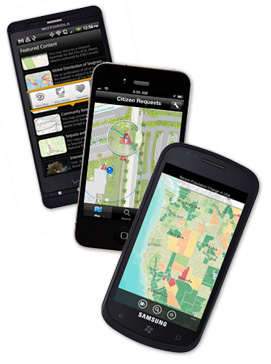
As a follow-up from my last post, I was interested in looking into the various management options for tracking the spread of invasive species. One of the more interesting options I have found is tracking them by smart phones.
There is an increasing number of smart phone apps that allow anyone with a GPS-equipped smart phone - so virtually anyone today - to be an active participant in the management of alien species. This allow scientists and managers to collect an amazing record of potentially alien species from sight-seers, school groups, hikers or volunteers who have an interest in botany. Most of the apps rely on geo-tagged photograps that are sent to qualified technicians who then process the data, map the occurrence of alien species and eventually make management decisions.
Some of these smart phone apps are: MISIN, That's Invasive, Rise, Plantas Invasoras. So the next time you find yourself in a protected areas, take a look at the plants and help the local managers maintain the local ecosystems!
nedjelja, siječnja 03, 2016
utorak, studenoga 03, 2015
Invasive species
Part of my thesis investigation deals with invasive species in the Galapagos, which is a fascinating subject to me.
Alien, introduced or exotic species are those that are found outside of their native range or ecosystem, most often being transported by humans deliberately; some of those species may negatively affect the new ecosystem, being then termed as invasive species.
Many of the current invasive species were brought to the Galapagos Islands for agricultural purposes by the colonists. Some of the more common plant examples include rose apple (Syzygium jambos), guava (Psidium guajava), blackberry (Rubus niveus), cuban cedar (Cedrela odorata), citrus (Citrus spp), cuban hemp (Furcraea hexapetala) and red quinine (Cinchona pubescens). Guézou et al. (2010) performed an extensive survey of the inhabited area of Santa Cruz, San Cristobal, Isabela and Floreana islands and recorded 754 alien plant species, whose most common use was ornamental.
But today the main concern is the introduction and spread of these species from the inhabited areas into the NP; it is estimated that roughly 1,14% of the area of NP is occupied by invasive plant species (CEPROEC-IAEN & SENPLADES, 2014).
According to my (somewhat simple) calculation of their spread in the next 10 years, the area covered by invasive species will be as shown in the map below.
Bibliography
Gardener, M. R., Trueman, M., Buddenhagen, C., Heleno, R., Jäger, H., Atkinson, R., & Tye, A. (2013). A Pragmatic Approach to the Management of Plant Invasions in Galapagos. In L. C. Foxcroft, P. Pyšek, D. M. Richardson, & P. Genovesi (Eds.), Plant Invasions in Protected Areas (pp. 349–374). Dordrecht: Springer Netherlands.
Guézou, A., Trueman, M., Buddenhagen, C. E., Chamorro, S., Guerrero, A. M., Pozo, P., & Atkinson, R. (2010). An Extensive Alien Plant Inventory from the Inhabited Areas of Galapagos. PLoS ONE, 5(4), e10276.
CEPROEC-IAEN, & SENPLADES. (2014). Diagnóstico y análisis biofísico para evaluación y formulación de escenarios de desarrollo en el Archipiélago de Galápagos (No. Informe Técnico CEPROEC IT2014_01) (p. 402). Quito: IAEN, Senplades.
Alien, introduced or exotic species are those that are found outside of their native range or ecosystem, most often being transported by humans deliberately; some of those species may negatively affect the new ecosystem, being then termed as invasive species.
Many of the current invasive species were brought to the Galapagos Islands for agricultural purposes by the colonists. Some of the more common plant examples include rose apple (Syzygium jambos), guava (Psidium guajava), blackberry (Rubus niveus), cuban cedar (Cedrela odorata), citrus (Citrus spp), cuban hemp (Furcraea hexapetala) and red quinine (Cinchona pubescens). Guézou et al. (2010) performed an extensive survey of the inhabited area of Santa Cruz, San Cristobal, Isabela and Floreana islands and recorded 754 alien plant species, whose most common use was ornamental.
But today the main concern is the introduction and spread of these species from the inhabited areas into the NP; it is estimated that roughly 1,14% of the area of NP is occupied by invasive plant species (CEPROEC-IAEN & SENPLADES, 2014).
According to my (somewhat simple) calculation of their spread in the next 10 years, the area covered by invasive species will be as shown in the map below.
The projected spread of invasive species on Isabela Island (shown in red and yellow) in the next 10 years.
Bibliography
Gardener, M. R., Trueman, M., Buddenhagen, C., Heleno, R., Jäger, H., Atkinson, R., & Tye, A. (2013). A Pragmatic Approach to the Management of Plant Invasions in Galapagos. In L. C. Foxcroft, P. Pyšek, D. M. Richardson, & P. Genovesi (Eds.), Plant Invasions in Protected Areas (pp. 349–374). Dordrecht: Springer Netherlands.
Guézou, A., Trueman, M., Buddenhagen, C. E., Chamorro, S., Guerrero, A. M., Pozo, P., & Atkinson, R. (2010). An Extensive Alien Plant Inventory from the Inhabited Areas of Galapagos. PLoS ONE, 5(4), e10276.
CEPROEC-IAEN, & SENPLADES. (2014). Diagnóstico y análisis biofísico para evaluación y formulación de escenarios de desarrollo en el Archipiélago de Galápagos (No. Informe Técnico CEPROEC IT2014_01) (p. 402). Quito: IAEN, Senplades.
subota, kolovoza 22, 2015
Mapping ecosystem services
Ecosystem services can be defined as benefits that humans obtain from ecosystems, and are divided into four categories (Millennium Ecosystem Assessment (Program), 2005), as shown below, which can be evaluated globally. Many ecosystem services have been reduced in the recent past, most notably fisheries, water supply and purification, waste treatment, natural hazard protection, regulation of air quality, regulation of regional and local climate, among others.
Ecosystem services. Adapted from (Millennium Ecosystem Assessment (Program),
2005)
For my thesis I decided to work with ecosystem services instead of biodiversity since not enough georeferenced information was available. I found an assessment of the ecosystem services of the ecosystems on Galapagos Islands that have been evaluated by their trend (improved, improving, mixed or deteriorating) and the importance (high,
medium high, medium low and low). After giving these descriptive values a numeric value, and assigning that final value to terrestrial ecosystems on Galapagos, I got the following map as a result.
Note that the orange-red area is the highest value ecosystem - the humid zone, the orange area is the second-highest value - the arid zone, while the pale yellow is the lowest value ecosystem - the transitional zone.
References: Millennium Ecosystem Assessment (Program). (2005). Ecosystems and human well-being: synthesis. Washington, DC: Island Press.
utorak, lipnja 16, 2015
Environmental Risk Surface
Environmental Risk Surface is a module of the Protected Areas Tools developed by The Nature Conservancy, which is an extension for ArcMap. I've started using it for my thesis recently and so far so good! I was initially worried about taking on new software for something as important as my thesis, since I have no direct support to guide me, but for the moment I'm satisfied. The User's manual could use more detail, but I managed to get it to work.
The software lets the user spatially connect data on threats (human or natural) and conservation data. In my case, I am looking at geo-referenced human activities, such as garbage disposal, roads, urbanization, etc. After assigning an impact zone for each, relative intensity between all of them is determined and then input into the software. There are several option on the decay type of the impact and how individual impacts overlap, depending on expert opinion.
To make a long story short, this is a sample of the output of the program. Here I'm looking at roads, that have been divided into three categories - primary, secondary and paths on Santa Cruz island on Galapagos.
Each category has a different impact zone, based on its characteristics and expert opinion, which looks like this after the ERS has produced a raster based in the input:
The red zone that around the primary roads indicates strongest impact and it is also most far-reaching. Most roads are secondary so the prevailing colors are yellows and greens, indicating that their impact is smaller. The next image focuses on paths that have the smallest impact zone and intensity, so their buffers are comparatively small.
After obtaining similar rastes for all the human threats I'm considering, I will combine them in one layer, that can be overlain with areas that are important for conservation, thus indicating conservation-important areas that are being threatened by human activities.
The software is available at: http://maps.usm.edu/pat/
subota, travnja 18, 2015
Solid waste in Ecuador
Waste generation and
its management are sensitive subjects for most municipalities, and even more so
in the developing countries, where problems encompass the growing production of
waste, very low consumer consciousness, limited incentives for separation of
waste at the source, problems in the recycling chain, disposal management, to
name a few.
When it comes to
impacts of waste generation and management, they range from air contamination
and release of greenhouse gases that contribute to global warming, leachates
that contaminate water and soil with chemicals such as heavy metals and organic
compounds, and numerous health effects for the waste management workers and
local populations.
In Ecuador, the
current solid waste generation rate is 0,81 kg/person/day, but there are large
differences between regions. According to Soliz Torres (2015), the differences between
the highest and lowest producing cantons are extreme and range from 0,1 to 2,21
kg/person/day for 2012.
The great majority of
waste disposal sites in the country are waste dumps that use virtually zero
management techniques, but they are in a process of being closed permanently
and substituted by sanitary landfills that generate fewer health and
environmental impacts, a goal that should be accomplished by 2017.
Unfortunately, due to
the confidentiality agreement of my work contract, I can’t publish my own work
regarding the subject, so instead I present here a map published by Soliz
Torres in a very interesting article entitled “Political ecology and critical
geography of waste in Ecuador”.
Source: Soilz Torres (2015): Political ecology and critical geography of
waste in Ecuador. Letras
Verdes. Revista Latinoamericana de Estudios Socioambientales N.° 17, marzo
2015, pp. 4-28
srijeda, veljače 25, 2015
Conservation prioritization
The time has come to do some more research on my thesis, which deals with identifying conservation priorities in the Galapagos Islands.
http://www.galapagostours.net/images/galapagos-map.jpg
The field of identifying conservation priorities is known as
conservation prioritization, and can be defined as “the process of using
spatial analysis of quantitative data to identify locations for conservation
investment”[1],
which isn’t applied only to protected areas, but can also pertain to management
strategies and conservation activities outside them. One of the more important
considerations in conservation prioritization is that of comprehensiveness, by
which the ideal conservation area should contain the composition, structure and
function representative of the biodiversity feature. The complementarity
principle should also be considered, since it states that costs should be
optimized while ensuring that all biodiversity features receive benefit;
furthermore, prioritization should be designed for the long term, with
considerations for cost-effectiveness and taking into account threats that
biodiversity faces.
The prioritization is a socio-political process, in which the goals are determined
by societal considerations, but one in which science is the key provider of
technical information and options. Even though mapping of the relevant factors
is in itself an important aspect of this process, it should not focus solely on
this tool in order to design a successful conservation strategy, but also
include stakeholders opinions, development of scenarios, of decision support
systems, social marketing, facilitation and conflict resolution, institutional
establishment, monitoring and management, to name a few. The scope of the
current work, however, only includes the production of the prioritization map
due to technical, political and economic restraints.
http://i.telegraph.co.uk/multimedia/archive/01692/galapagos_1692336c.jpg
The identification of conservation goals is the initial phase of the
process, followed by identifying the variables (factors or system attributes)
to be considered, which is a scientific and technical stage involving the
understanding and describing of the dynamic relations that define the ecology
of a system. The next phase requires the gathering of information of the
previously defined factors, which should principally be spatial information; in
the absence of georeferenced data, carefully selected proxies can be used. The final
and critical phase is to perform the prioritization analysis itself by means of
one of the two basic principles: scoring of factors or complementarity based
approach.
A
variety of software has been designed with the purpose of aiding in the process
of conservation prioritization analysis, such as MARXAN, Zonation, C-Plan,
Res-Net, and this current work will use one such tool (Environmental Risk
Surface, ERS) in order to determine priority conservation areas in the
Galapagos Islands. Literature
pertaining to the ERS software is extremely limited, therefore the main basis
for this investigation is the work of McPherson et al. (2008) and Lessmann et
al. (2014), both assessing human impact on conservation. McPherson et al. use
GIS tools to assign weight and distance of influence to several human
activities and map its impacts, in order to identify optimal conservation areas
in Jamaica. Lessmann et al., on the other hand, use GIS map the distribution of
target species, include conservation feasibility costs, in order to identify
conservation gaps in Ecuador. Both articles focus on conservation efforts while
evaluating and mapping the effect of such human influences as population,
roads, tourism, agriculture, mining, and will thus offer guidance in the
judgment of their impact.
References
Ferrier, S., & Wintle, B. A. (2009). Quantitative
approaches to spatial conservation prioritization : matching the solution to
the need. In Spatial Conservation Prioritization. Quantitative Methods and
Computational Tools (p. 328). New York: Oxford University Press.
Knight, A. T., Cowling, R. M., Possingham, H., &
Wilson, K. A. (2009). From theory to practice: designing and situating spatial
prioritization approaches to better implement conservation action. In Spatial
Conservation Prioritization. Quantitative Methods and Computational Tools (p.
328). New York: Oxford University Press.
Lessmann, J., Muñoz, J., & Bonaccorso, E. (2014).
Maximizing species conservation in continental Ecuador: a case of systematic
conservation planning for biodiverse regions. Ecology and Evolution, n/a–n/a.
doi:10.1002/ece3.1102
McPherson, M., Schill, S., Raber, G., John, K., Zenny,
N., Thurlow, K., & Sutton, H. (2008). GIS-based Modeling of Environmental
Risk Surfaces (ERS) for conservation planning in Jamaica. Journal of Conservation
Planning, 4, 60–89.
[1] Wilson, Cabeza,
& Klein, C., 2009, pg. 16
nedjelja, prosinca 28, 2014
Does Santa use GPS?
'Tis the season to be jolly... and wonder how Santa Claus gets around the world in just one night, getting every child's address right, especially considering that the world population gets bigger and bigger every year. The world today counts around 7,2 billion and around 31% are Christians, so that's a pretty large number of kids to visit in just one night!
Does he use a GPS to get around? Maybe... It would definitely make sense, considering the daunting responsibility that rests on his shoulders, so that option makes sense to me, technically speaking. But thinking that he's been around for so long, and that there's definitely magic involved with everything Santa does, at heart I believe he prefers the old-fashioned stellar navigation.
Google's Santa tracker - personally my favorite :)
NORAD's website
TrackSanta
Santa did his job really well this yeas, as always, so he's taking his well-deserved break till the preparations begin for next season. And the mystery still remains as to how he gets around the whole globe in just one night...
Does he use a GPS to get around? Maybe... It would definitely make sense, considering the daunting responsibility that rests on his shoulders, so that option makes sense to me, technically speaking. But thinking that he's been around for so long, and that there's definitely magic involved with everything Santa does, at heart I believe he prefers the old-fashioned stellar navigation.
source: prweb.com
Whichever the case, there's a few websites that let you keep track of Santa's progress through the Christmas night, so you can stay up and wait for him with cookies and milk and ask for yourself about how he navigates the skies; here's to list just a few:Google's Santa tracker - personally my favorite :)
NORAD's website
TrackSanta
source: santatracker.google.com
Santa did his job really well this yeas, as always, so he's taking his well-deserved break till the preparations begin for next season. And the mystery still remains as to how he gets around the whole globe in just one night...
nedjelja, studenoga 16, 2014
Online Courses
I've been doing a lot of ESRI online courses lately as part of the UNIGIS program, and I have to say - they're really good. There are two basic types of courses offered by ESRI - instructor-led courses and online courses. Being in Ecuador, only the online courses are available to me, though I hope to someday be able to have a live course too.
The online courses are nothing to complain about, though. Lots of useful topics with a good theoretical introduction, often solidifying the basics and then followed by well-explained exercises - a good combination between theory and practice. So far, my favorites are the 3D visualization technique courses and site selection courses.
Sometimes, though, it can be difficult to know the best order to take them in, and then I end up doing a more advanced course first or repeating some topics, but that's not such a big problem. After all, repetitio mater studiorum est!
The online courses are nothing to complain about, though. Lots of useful topics with a good theoretical introduction, often solidifying the basics and then followed by well-explained exercises - a good combination between theory and practice. So far, my favorites are the 3D visualization technique courses and site selection courses.
Sometimes, though, it can be difficult to know the best order to take them in, and then I end up doing a more advanced course first or repeating some topics, but that's not such a big problem. After all, repetitio mater studiorum est!
utorak, listopada 07, 2014
Thesis time!
The time has
come to face the final challenge in the UNIGIS Master program: the thesis.
Being an
ecologist, I wanted the work to take into account my interests, both personal
and professional. And, I am currently working on a project regarding the world-famous
Galapagos Islands in Ecuador, so I thought why not combine both. After some
research, I think I found my topic: Identifying terrestrial conservation
priorities in the Galapagos Islands, based primarily on anthropogenic threat assessment.
http://nothingtoloseandaworldtosee.files.wordpress.com
The conservation
of the famed Galapagos Islands experienced two crucial points during its
history: it started officially in 1959 with the creation of the Galapagos
National park, and was later expanded to the marine ecosystem by forming the
Galapagos Marine Reserve in 1996. However, by that time, the archipelago had
experienced severe human influence that first started with the discovery of the
Islands in 1535, intensifying strongly with the beginning of organized
colonization in 1983 and continuing relentlessly ever since. Today, the
Galapagos NP encompasses 96,7% of the islands (7 731 km2) and the Marine
Reserve reaches up to 40 miles from the Islands (138 000 km2), but anthropogenic
influence is still great and poses a significant threat to the conservation
efforts.
The primary
factor of influence is tourism, which has sky-rocketed in the last decades,
causing strong immigration of the Ecuadorean population from the continent,
bringing with it almost complete dependence of energy, food and water from the
continent, and causing a host of problems: introduced and invasive species,
illegal and uncontrolled fishing, contamination of aquifers and soil,
inadequate or (for the most part) inexistent solid waste and residual water
management, rampant urbanization, among others. These factors keep altering the
fragile ecosystems of the Galapagos Islands, despite the constitutional
protection that Pacha Mama (Mother Nature) enjoys in Ecuador and the continuous
efforts of the NP and Marine Reserve management.
http://static.guim.co.uk/sys-images/Travel/Pix/pictures/2006/04/19/galapagos360.jpg
Despite the
strong scientific interest in Galapagos, there have been few attempts to
quantify the anthropogenic influences suffered by the ecosystems. However, it
is precisely by means of a thorough evaluation of human risk factors risk that
conservation of the Islands should be managed, in order to aim its valuable and
costly efforts into particular human activities, specific areas and species.
The objective of
the project will be to perform an ecological risk assessment for terrestrial
conservation in the Galapagos Islands based on anthropogenic risk factors, and
identify areas that represent conservation priorities.
So… the next
step is to gather all the information available in order to identify, quantify
and spatially delimit the influences that the terrestrial ecosystems of
Galapagos face due to various human activities, and also to identify and
localize the distribution of target terrestrial species on the islands. With that,
it will be possible to identify areas that require particular conservation
efforts, based on an overlay of quantified threats and identified species, and
finally to produce a map of conservation priority areas.
So now cross my
fingers and start working…
nedjelja, kolovoza 03, 2014
Map apps galore
My last blog entry made me want to take a loser look on map apps for
smartphones. I have a Sony Xperia so Android app store on Google Play is the
basic investigation tool for this task.
So far I have been using Maps and My Tracks, both developed by Google,
and I consider them sort of basic types of map apps for any novice user. And what I consider essential is that you can use
both offline, so even if you don’t have internet access at all times, you can
still use these apps to figure out where you are.
Maps is just like Google Maps that we all access online to search for a specific street, address or business. Their maps are very accurate and the layers available are satellite, terrain, traffic, etc. You can use as Maps a simple and effective navigation tool, search for near-by business and depending on your location in the world, there are live traffic updates and Street View options available.
Maps

My Tracks app is excellent for recording your path, speed, distance, and elevation during any outdoor activity – I’ve tried it during bus rides, cycling and walking and it works perfectly. You can add notes at certain points, view statistics and hear periodic voice announcements of your progress. Your track can be synced on Google Drive and shared with other Google users.
My Tracks
There’s another nice little free app that a lot of outdoorsy people like
to use, the MapMyRide. It offers the standard services of mapping your route
and tracking the activity type, but it can also keep track of the foods you eat
so as to accurately calculate your calorie output.
MapMyRide calorie counter
Then you can go ahead and share your route with your friends and look
for interesting routes posted by others in your area or anywhere else you’re planning
to visit. A highly recommended app.
A route shared through MapMyRide
There seems to be countless map apps out there, just go ahead and invest a couple of days to try out a few and see which one suits your needs the best. And have fun!
četvrtak, lipnja 26, 2014
Mobile GIS
Mobile technologies keep growing in capabilities, diversity and availability by the week. The decreasing prices of mobile devices and mobile services, better coverage and new software have made it one of the most dynamic services today - so no wonder that mobile GIS applications are getting more and more popular, both in the professional world and with the average outdoor enthusiast.
Being free from desktop hardware has many advantages. The user can easily use relatively cheap smartphones or tablets to access maps, collect and report data and even perform analysis. The software client interface is usually simpler, the costs of data collection can be greatly reduced and the data can be quickly synchronized with the client’s servers.
However, mobile technology has
some drawbacks as well. The small screen size of smartphones, short battery
life, limited keyboard functionality and limited processing power are some of
the most common shortcomings of mobile GIS.
Nevertheless, most professional GIS
software companies, such as ESRI and Google, are investing in this quickly
developing market, constantly developing their mobile and online services. But
there are also many start-ups and web communities that are developing their own
mobile GIS solutions, that may be more easily adapted to personal users or
small business needs. There are services that are available online and offline
so not even a remote location is out of reach.
utorak, lipnja 10, 2014
ArcGIS Online, a map service for everyone
While working on the latest module of the UNIGIS master
course, I am beginning to get acquainted with various online map services. One
of the more interesting ones is the ArcGIS Explorer Online, available at http://www.arcgis.com/explorer.
The website offers many interesting user-made theme maps,
such as World AIDS Day Map, Import and Export of Plastic Waste, Forest Areas in
Europe, etc. These maps can serve as a good starting point or illustration for
a student investigation or visual information for the interested public.
But the real benefit of this map service is the ability to
create (and publish) one’s own theme map. The ArcGIS Explorer offers base maps
where a user can easily add information of interest, explore overlays and see
associated data. You can look for information shared by other users based on keywords, import your own data or use your previously stored information.
In this way, the user can explore publicly available or
personal data without the need for a professional and expensive software, and
what is more, share this information with people he/she chooses or publish it
for everyone to access.
For example, I investigated the occurrence of wildfires in the United States and produced a map that can be accessed here. It is fun and easy, really a tool for everyone.
utorak, ožujka 04, 2014
More Deforestation Tools
Continuing on the last post, there is great news for those interested in deforestation. The World Resources Institute (WRI, USA) has launched a Global Forest Watch project (GFW) which claims to track forest loss "in near real time".
Making use of Landsat images, Google Earth Engine, Google Earth Maps and algorithms from the University of Maryland, the GFW will be a powerful tool for those needing up-to-date information. Organizations such as NGO's, local grassroot organizations but also politicians and companies will be able to monitor the areas of particular interest for current information, monitoring the success of environmental policies or the far-trade status of their products.
"From now on, the bad guys cannot hide and the good guys will be recognized for their stewardship." said Dr Andrew Steer from WRI.
For more information, visit http://www.globalforestwatch.org/
Source: BBC News
Making use of Landsat images, Google Earth Engine, Google Earth Maps and algorithms from the University of Maryland, the GFW will be a powerful tool for those needing up-to-date information. Organizations such as NGO's, local grassroot organizations but also politicians and companies will be able to monitor the areas of particular interest for current information, monitoring the success of environmental policies or the far-trade status of their products.
An example of the areas of tree loss in Ecuador, from GFW project
"From now on, the bad guys cannot hide and the good guys will be recognized for their stewardship." said Dr Andrew Steer from WRI.
For more information, visit http://www.globalforestwatch.org/
Source: BBC News
srijeda, siječnja 01, 2014
Deforestation as seen by Google
Google Earth has been recently used to produce a detailed map of the world’s forest resources and how they have changed between 2000 and 2012. As reported by BBC, a research group at the University of Maryland used the free service to map the forest extent in 2000 and 2014 and then calculated deforestation and reforestation for the period. This interesting project shows how freely available data can be used for high-impact projects.
Global Forest Change Project used 654,178 Landsat 7 images to document the loss of 2.3 million km2 and gain of 0.8 million km2 from 2000 to 2012. Brazil had marked a large success by reducing deforestation in this period, but this was offset by extreme deforestation in Indonesia, Malaysia, Paraguay and Angola. The largest forest loss was produced in the tropics (2101 km2/year), second by boreal forest loss.
However, the positive news from Brazil may be too soon to start celebrating, reports the BBC. Brazilian minister Izabella Teixeira has recently commented that deforestation rate has increased by a staggering 28% between August 2012 and July 2013, despite the reduction in previous years.
Whatever the case may be, the Global Forest Change Project may prove to be a strong investigation tool, since it can be updated annually and at a fraction of a cost of commercial imaging services. This global imaging service may prove to be a strong information source to governments and activist groups in fighting illegal deforestation, control and planning, should they choose to use it.
For more information, visit the project map by the University of Maryland or read the original research article here.
subota, studenoga 30, 2013
So we begin... UNIGIS
Until now, this has been my personal travel blog. After I
graduated, I went on a one-year trip across South and Central America and kept
my family and friends updated through this medium, therefore the name Maja In The World. Most of the previous
entries are in Croatian so not many of my GIS colleagues will be able to read
it, so from this point on, I will write in English.
This blog will contain my experiences in the GIS world, my
problems and successes and interesting GIS-related information that I find.
For the moment, I recommend this interesting website of the GIS
Master program, UNIGIS, that I am taking and that I highly recommend.
So let the fun begin!
ponedjeljak, studenoga 22, 2010
Limenkijada
Limenkijada ili izvorno Latada je završni tjedan inicijacije na fakultetima Coimbre. Događa se zadnji tjedan u listopadu i obilježava pristupanje brucoša u studentsko tijelo.
Mjesec dana sam gledala kako stariji studenti, obučeni u svoja crna odijela i plašteve, zapovijedaju brucošima.

Najčešće su u pitanju neke smiješne igrice i pjesme, ali znaju ih natjerati da u menzi jedu bez pribora ili bez ruku, da jedna osoba nosi sve stvari grupe studenata, šišaju ih ako ih zateknu vani iza ponoći i slično. Pristupanje inicijaciji je na dobrovoljnoj bazi ali velika većina studenata ide za time jer se stječu poznanstva i formiraju grupe koje kasnije mogu biti jako korisne.
Veliko finale Latade je parada koja ide od Sveučilišta do rijeke Mondego. Stariji studenti nose svoja svečana odjela dok se brucoši oblače u kostime koje su im napravili njihovi "kumovi".
Najčešće su to glupavi kostimi - plastične vreće u bojama fakulteta s predimenzioniranom dudom (da se istakne kako su oni još mali i neiskusni), ali ima i nekih zanimljivih, poput dečkiju obučenih kao orijentalne plesačice (na lancu), zanimljivih životinja i sl. Svaki fakultet mazne kolica iz supermarketa i u njima prvo vozi prvo cugu a kasnije pijane studente.

Brucoši obavezno imaju i nešto što neodoljivo podsjeća na kahlicu, gdje skupljaju lovu što isprose od prolaznika i cugu (nadam se ne istovremeno). Također, na nogama ili o struku nose limenke da bi ih se što dalje čulo, pa se zbog toga fešta i zove Latada (Lata=limenka). Za svaku fotku traže bakšiš, to me podsjeća na Peru :)

Uglavnom, povorka završava u rijeci - studenti se krste vodom Mondega. Dečki se skinu u bokserice ili ponekad do kraja i skaču u rijeku dok se djevojke uglavnom samo polijevaju vodom po glavi.
No njihove muke ne završavanju do svibnja, kada je na redu Queima das Fitas (Spaljivanje vrpci).

Svaki fax ima svoju boju i studenti nose vrpce u toj boji ili na plaštu ili sa knjigama. Davnih dana je akademska godina završavala u svibnju te su studenti slavili spaljivanjem vrpci svoga fakulteta. Ali vremena su se sprmijenila i akad. godina završava dva mjeseca kasnije, tako da danas zapravo prvo slave a tek onda idu na ispite!
Najsmješnije je kako se ponašaju roditelji... Studenti, obučeni u crna odijela, plašteve, s cilindrima i štapovima idu povorkom prem rijeci, ali ovaj puta s još više alkohola. Svaki fax ima svoje tematsko vozilo iz kojeg dijele alkohol, tako da su gotovo svi pijani već na početku parade.
Onda vidiš roditelje kako s ponosom u očima gledaju svog studenta kako tetura po cesti, i onda se svi grle i ljube. I to su onda studenti, akademsi građani, budućnost zemlje... Kod nas je recimo slično za norijadu, ali to su ipak srednjoškolci. Uglavnom, nakon te parade brucoši dobiju pravo da nose fakultetsku odoru i postanu "pravi" studenti. I naravno, zavrijede pravo da zezaju sljedeću generaciju na jesen :)
nedjelja, listopada 24, 2010
Samostan Sv Klare
Ovaj tjedan sam bila slobodna pa sam ga iskoristila za razgledavanje Coimbre. Znam, provela sam već 3mjeseca ovdje prošli semestar, ali nam je raspored bio toliko pretrpan da jednostavno nisam ništa stigla razgledati kako spada.
Sada sam se zaputila u Menasterio Santa Clara A-Velha (stari Samostan Sv. Klare, jer postojij i novi). Sagrađen je u XIV.st. na lijevoj obali rijeke Mondego. Iako je jedan samostan tamo već postojao 20ak godina, kraljica Isabel (Elizabeta) ga je praktički izgradila iz temelja, zamjenjujući staru drvenu konstrukciju velikim kompleksom od kamena i posvetila ju Sv.Klari.
Kraljica Isabel je bila vrlo pobožna i često je darivala siromahe, čemu se kralj Dom Dinis navodno protivio (on je usput rečeno uspostavio Svečilište u Coimbri 1290.g). U jednoj prilici, kada je noslia kruh da ga podijeli siromasima, Dom Dinis ju je zaustavio i zahtjevao da vidi što to nosi. Otvorivši zavežljaj, sav kruh se pretvorio u ruže. Zbog toga događaja se Isabel često prikazuje s cvijećem u krilu.
Nakon smrtije kanonizirana i postala St.Isabel. No njen samostan nije baš imao sreće: kako je rijeka Mondego napredovala tijekom godina samostan je često poplavljivan. Nakon stotinjak godina najniže razine su bile stalno pod vodom te su klarise gradile polukatove da pobjegnu vodi. No do 1677 morale su do kraja napustiti samostan i preseliti se u novi: St Clara A-Nova, na drugoj strani rijeke i na povišenom terenu. Stari samostan je ostao potpuno zapušten, poplavljen i zapunjen sedimentima rijeke sve do XX.st. kada je počela restauracija.
Od suza koje je Ines isplakala na mjestu otmice stvorio se izvor – Fonte das Lagrimas. Uskoro nakon toga, Isabel je pogubljena u samostanu Sv.Klare. No dom Pedro se nije mogao pomiriti sa sudbinom i nakon smrti staroga kralja porglasio je da se u tajnosti vjenčao s Ines. Naredio je da se njeno tijelo ekshumira i unese u dvor, gdje je prisilio da svi dvorjani u znak odanosti poljube njenu (raspadajuću) ruku. Zaista se ne može reći da je u Portugalu bilo dosadno u to vrijeme...
Nakon nekoliko godina sam ponovo osjećala kao da da sam na putu, opet negdje u svijetu. Sama, ne znam točno kuda idem, s vodičem u ruci i ruksakom na leđima, bez žurbe... savršeno! Bila sam tako sretna kada sam to shvatila! I još k tome relativno stran jezik – sve se poklopilo. Na površinu je isplivao stari poznati osjećaj za kojeg nisam ni znala da mi nedostaje. Morat ću sve to nadoknaditi u Ekvadoru :)
Sada sam se zaputila u Menasterio Santa Clara A-Velha (stari Samostan Sv. Klare, jer postojij i novi). Sagrađen je u XIV.st. na lijevoj obali rijeke Mondego. Iako je jedan samostan tamo već postojao 20ak godina, kraljica Isabel (Elizabeta) ga je praktički izgradila iz temelja, zamjenjujući staru drvenu konstrukciju velikim kompleksom od kamena i posvetila ju Sv.Klari.
Kraljica Isabel je bila vrlo pobožna i često je darivala siromahe, čemu se kralj Dom Dinis navodno protivio (on je usput rečeno uspostavio Svečilište u Coimbri 1290.g). U jednoj prilici, kada je noslia kruh da ga podijeli siromasima, Dom Dinis ju je zaustavio i zahtjevao da vidi što to nosi. Otvorivši zavežljaj, sav kruh se pretvorio u ruže. Zbog toga događaja se Isabel često prikazuje s cvijećem u krilu.
Nakon smrtije kanonizirana i postala St.Isabel. No njen samostan nije baš imao sreće: kako je rijeka Mondego napredovala tijekom godina samostan je često poplavljivan. Nakon stotinjak godina najniže razine su bile stalno pod vodom te su klarise gradile polukatove da pobjegnu vodi. No do 1677 morale su do kraja napustiti samostan i preseliti se u novi: St Clara A-Nova, na drugoj strani rijeke i na povišenom terenu. Stari samostan je ostao potpuno zapušten, poplavljen i zapunjen sedimentima rijeke sve do XX.st. kada je počela restauracija.
Sada se uz samostan nalazi muzej koji priča ovu priču, ali tokođer i o svakodnevnom životu u i oko samostana, prehrani, higijeni, obvezama, previma... jedan od ljepših muzeja koje sam posjetila: umjerene veličine, zanimljiv i s raznolikim aspektima, dokumentarcem, lijepo uređen, zaposlenici su im jako ljubazni i imaju audio guide (imala sam čast prva ga isprobati haha). Jedino što je gotovo potpuno prazan... gotovo da i nije bilo posjetitelja u 2sata koliko sam provela tamo. Doduše, već je listopad pa i nema toliko puno turista po Coimbri.
Nakon toga sam posjetila jedan poznati park: Quinta das Lagrimas. Tamo je oteta Ines de Castro, ljubavnica kralja Pedra I. (njegova baka je sv. Isabel). Ines je bila dvorska dama kraljici, no unatoč tome Pedro se morao oženiti njome a ne Ines. Nakon kraljičine smrti njih dvoje su se namjeravali vjenčati, no tatici (starom kralju) se to nije sviđalo jer je ona bila španjolka i taj brak bi španjolcima dao pravo na prijestolje. Uglavnom ,nakon što ih je nekoliko puta neuspješno razdvajao, stari kralj se odlučio na ekstremnije mjere. Dao je oteti Ines na mjestu gdje su se ona i Pedro sastajali, pored izvora Fonte de Amores koji se danas nalazi u parku Quinta das lagrimas.
Nakon nekoliko godina sam ponovo osjećala kao da da sam na putu, opet negdje u svijetu. Sama, ne znam točno kuda idem, s vodičem u ruci i ruksakom na leđima, bez žurbe... savršeno! Bila sam tako sretna kada sam to shvatila! I još k tome relativno stran jezik – sve se poklopilo. Na površinu je isplivao stari poznati osjećaj za kojeg nisam ni znala da mi nedostaje. Morat ću sve to nadoknaditi u Ekvadoru :)
Pretplati se na:
Postovi (Atom)
I may not have gone where I wanted to go, but I'm sure I ended up where I needed to be.